
The Backstory
As someone who has grown up playing and watching hoops, I’ve always wondered, “Does home court matter at the professional level?” Do players crack under pressure more? Do fans sway the referree? What does the data show? Due to the wide variety and popularity of different sports out there, I’m going to break this down into a three part series where I’ll analyze my favorite three to watch: Baseball, Basketball, and American Football. We’ve covered baseball in another post (linked below), which got a ton of reception, so thanks everyone for the love. Let’s take a look at the numbers for the hardwood, shall we?
If you were interested in the Baseball Study, here you go!

The Data Source
The amazing part about the NBA is how much data there is surrounding every aspect of the game. Points, Assists, Wins, Losses, Blocks, you name it, it’s all recorded. I went to my favorite big data website, Kaggle, and found a dataset from 2004-2021 that includes four files wih the following information:
- games.csv : all games from 2004 season to 2021 with the date of games, home/away teams, points scored, assists, and overall team level game details
- games_details.csv : individual player performance dataset per game, all statistics of players for a given game
- players.csv : players details – name, team, and season played
- ranking.csv : ranking of NBA given a day (split into west and east on
CONFERENCEcolumn) - teams.csv : all teams of NBA, stadium capacity, owner, GM, coach, and year founded
The amount of detail we have to work with in this dataset is astounding. In this post I will break down stats based around teams and their data to perform at a home or away stadium. With the dataset being 2004 to 2021, we have a good representation of the modern day NBA. If there is any other analysis you would like to see, please comment below!
The Data
So lets break down the data. Within the games.csv file, there is a column stating whether or not the home team won. This makes our life incredibly easy in calculating how often the overall NBA wins at home. Sum up that column and divide by the number of games played and you have NBA Home Winning Percentage. Lets see what that looks like.
Out of the dataset we have:
- Total Games Played = 25,796
- Home Team Wins = 15,155
- Away Team Wins = 10,641
Taking these numbers and making that a percentage, we find that in the modern NBA, the Home Team wins 58.75% of the time, and the Away Team wins 41.25% of the time
Individual Team Home Winning Percentage
Now this data is wonderful at summarizing the NBA as a whole, but what about on a team basis? One team can be winning a high percentage of their games at home, and that would offset a team losing majority of games at home. For these datasets, I iterated through each team in the database, calculating the same metric, but now on a team level basis. The data is then normalized at 50%. If a team has a positive (blue) value, they are that much more likely to win at home. If the number is negative (red) the opposing team is more likely to win by that much at home

What the chart shows is that from 2004-2021, you do NOT want to play in San Antonio. The Spurs have a 73.99% win rate at home. This means that the Spurs are 23.99% more likely to beat you if they are at home. How wild is that? Be careful if you ever find youself against the Spurs at home. On the flipside, against the Timberwolves, Knicks, Hornets, and Kings, Away teams are more likely to win. In the case of the Knicks with a 47% win rate at home, Away Teams are likely to win by as much at 3%.
Home Game Statistics
We now know that home court has an advantage in large majority of the teams, but why is that? Do teams happen to score more at home? Have more blocks at home? Lets take a look at the numbers.
Shown below is a plot of the average home team score across all teams, as you may notice, all of the average scores are very, close.

Calculating the average of all the teams, we a mean of 102.7 points scored per game with a standard deviation of 2.35 points. That means that from team to team, we can estimate the home scores will usually be within one bucket of each other? I was expecting a much larger variance from team to team, but this is so cool to see in charts. If this is the average of the teams at home, what does it look like when they play away?
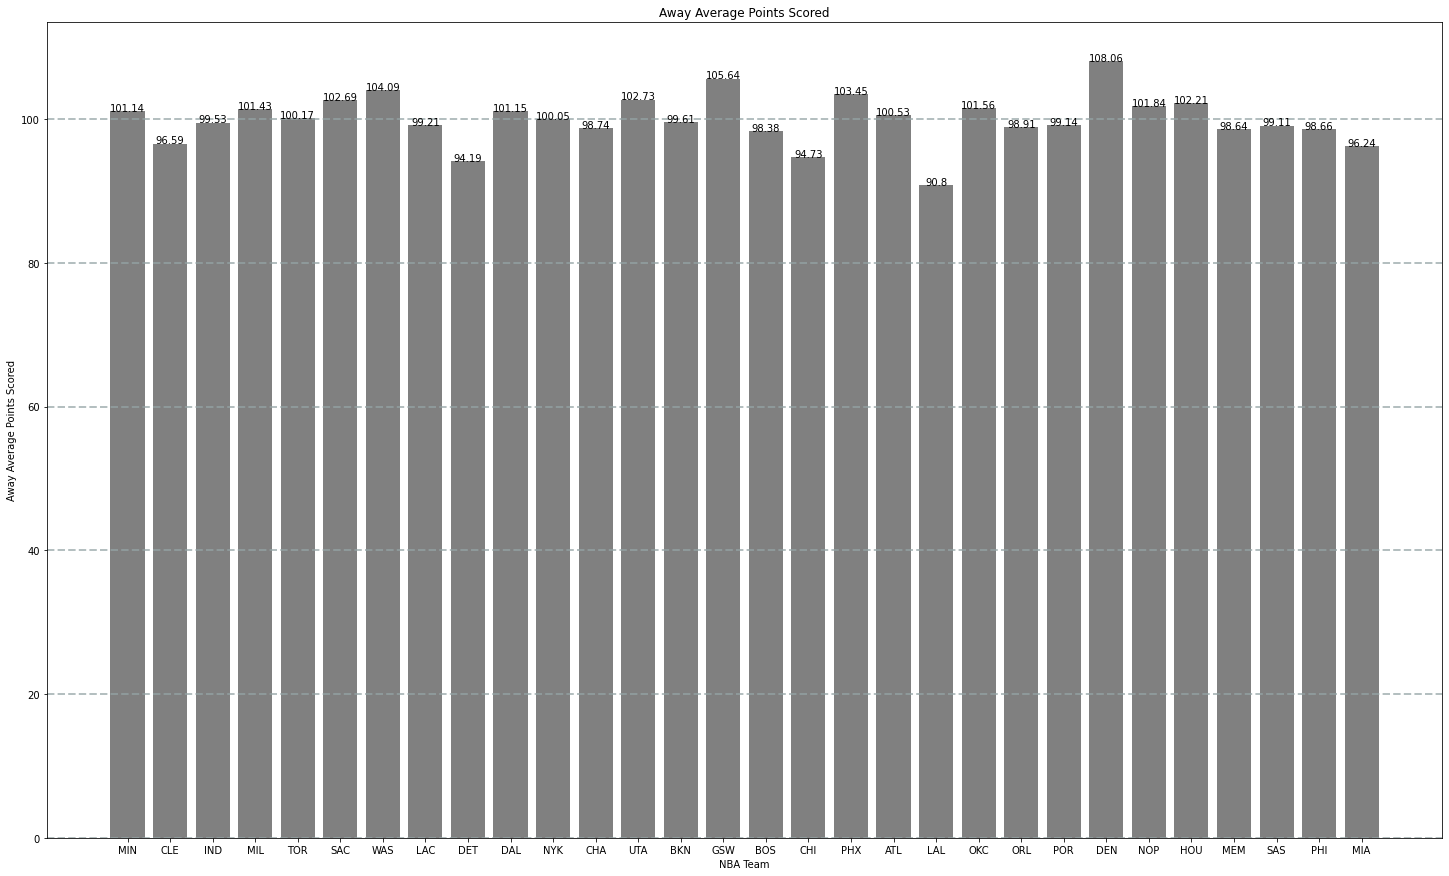
The data when a team is playing away has more variance. Points spread are not as consistent when a team is playing away, as noted by the standard deviation being larger. This means that teams can have a clear discrepancy between being strong on the road vs weak on the road. The data shows the Lakers typically score the least on the road, while Denver scores most on the road. Note this isn’t a statement that Denver is better, just typically scores more point on the road. Lakers record in total over this period of time was 886/828 with three championships, while Denver’s record was 969/770 with zero championships.
Average Points Scored By The Home Team from 2004-2021: 102.7 points

Standard Deviation between teams: 2.36 points
Average Points Scored By The Away Team from 2004-2021: 99.97 points

Standard Deviation between teams: 3.42 points
Offensive Stats
Now apart from points scored, I went and analyzed a few other statistics for offense at home vs. offense away. Points determine whether or not a team wins at the end of the day, but there are other measures to offensive prowess such as field goal percentage, and assists. I processed the numbers in the same way I processed the points, and the results are as follows:
Average Points Scored per game by The Home Team from 2004-2021: 102.7 points
Standard Deviation between teams: 2.36 points

Average Field Goal Percentage per game by the Home Team from 2004-2021: 45.84%
Standard Deviation between teams: 0.84%

Average Assists per game by The Home Team from 2004-2021: 22.64 assists
Standard Deviation between teams: 1.22 assists
Average Points Scored per game by The Away Team from 2004-2021: 99.97 points
Standard Deviation between teams: 3.42 points

Average Field Goal Percentage per game by the Away Team from 2004-2021: 44.77%
Standard Deviation between teams: 1.31%

Average Assists per game by The Away Team from 2004-2021: 21.33 assists
Standard Deviation between teams: 1.05 assists
The Meaning
So what does all of this say? In basketball, there are more points scored, higher field goal percentage, more assists, and more won games at home. There is a coorelation between being able to be at home, and having a stronger offense. However, as we saw in the Denver scenario, it doesn’t always mean the team will walk away with, or even go to the NBA Championship. NBA teams are streaky, the 2004-2010 Lakers were dominant, while the 2014-2019 Lakers had losing records every season, prior to Lebron coming onboard in 2020. The next steps in analyzing for me would be taking a look at how this can ba analyzed in the playoffs!!
Please consider subscribing and commenting Below if you enjoyed!
As always, thank you for taking the time to read my artice!
-Jon
The Sources
The source for this is the NBA games dataset on Kaggle.
All code,writings, and graphs are developed by Jon Barker. If you are interested, send me an email and I will send my code.

Leave a comment