
The Backstory
As someone who has been a sports fan their entire life, the question, “Does it really matter if a team is at home?” has always fascinated me. Do players crack under pressure more? Do the fans sway the referree? What does the data show? Due to the wide variety and popularity of different sports out there, I’m going to break this down into a three part series where I’ll analyze my favorite three to watch: Baseball, Basketball, and American Football. If there’s enough desire, I can expand these studies to other sports as well!
The Data Sources
So with this being such a widely covered topic (sports bring in big $$$. Big $$$ = big coverage), there will be a wide amount of data sources that I get to show and explain to you all. The first is a bleacher report article talking around comparison between all sports’ home field advantage. The next is Kaggle, one of my favorite websites. Kaggle has a wide variety of datasets that allow me to run my own code on. Time to see some charts baby!
If you’ve seen Moneyball, you know the sports data craze essentially started with baseball, because each situation is a static situation, so there is an incredible study on sabr.org surrounding the winning percentages
The Data
With sports being very intensely studied over the base, I found many incredible studies, and a lovely data source on 538 talking about the topic. The data set included every team in the MLB from 1871 all the way through the 2021 season. The data set included what team was home, which was away, scores, pitcher ratings, and even ELO. (CHESS RATING IN BASEBALL!?) Primarily, all I needed was the home and away team, and the score, so I filtered the dataset down, imported into my Jupyter Lab, and off we went.

First to do is calculate how big of an advantage does the home team win? Score one is always the home team, and score 2 is always the away, so if score 1 wins more often than score 2, we will know whether or not the home team wins more often. If we iterate through our database and tally up how often the home team wins, we can get our percentage!
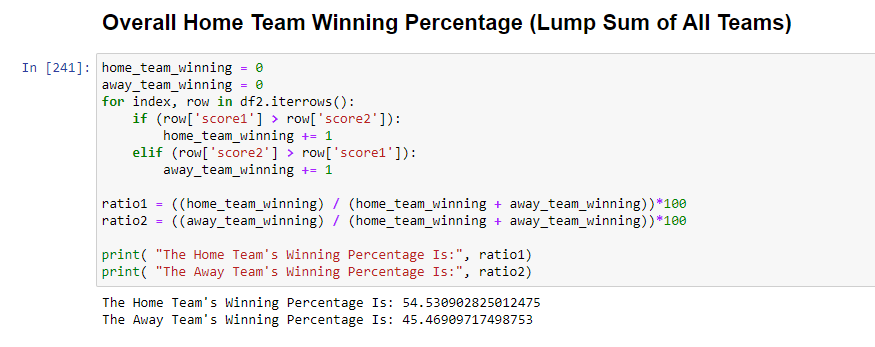
And there we have it. Home team historically in baseball wins 54.53% of the time, while the Away team wins 45.46% of the time.
Now this is pretty cool and all, but I was curious. Do some teams have better pull at home? Maybe some fanbases are harder to play againist than others? What if we checked to see which teams won all of these games, and graphed that all out.
Individual Team Home Winning Percentage
So we know the overall percentages, but what if one team had a better home win rate? Could we say that a teams fans are stronger? Does it make more of a difference for one team than another?
We accomplished this by creating a dataframe of all the team names (df3), and searched our games database for every instance that a team was at home. If they won at home, that was counted in one variable, and if they lost at home, that was tallied in another. Create a ratio between the two, and bam, you know how a team performs at home.

So we have a dataframe of all the teams Home Win Ratio…who has the highest?
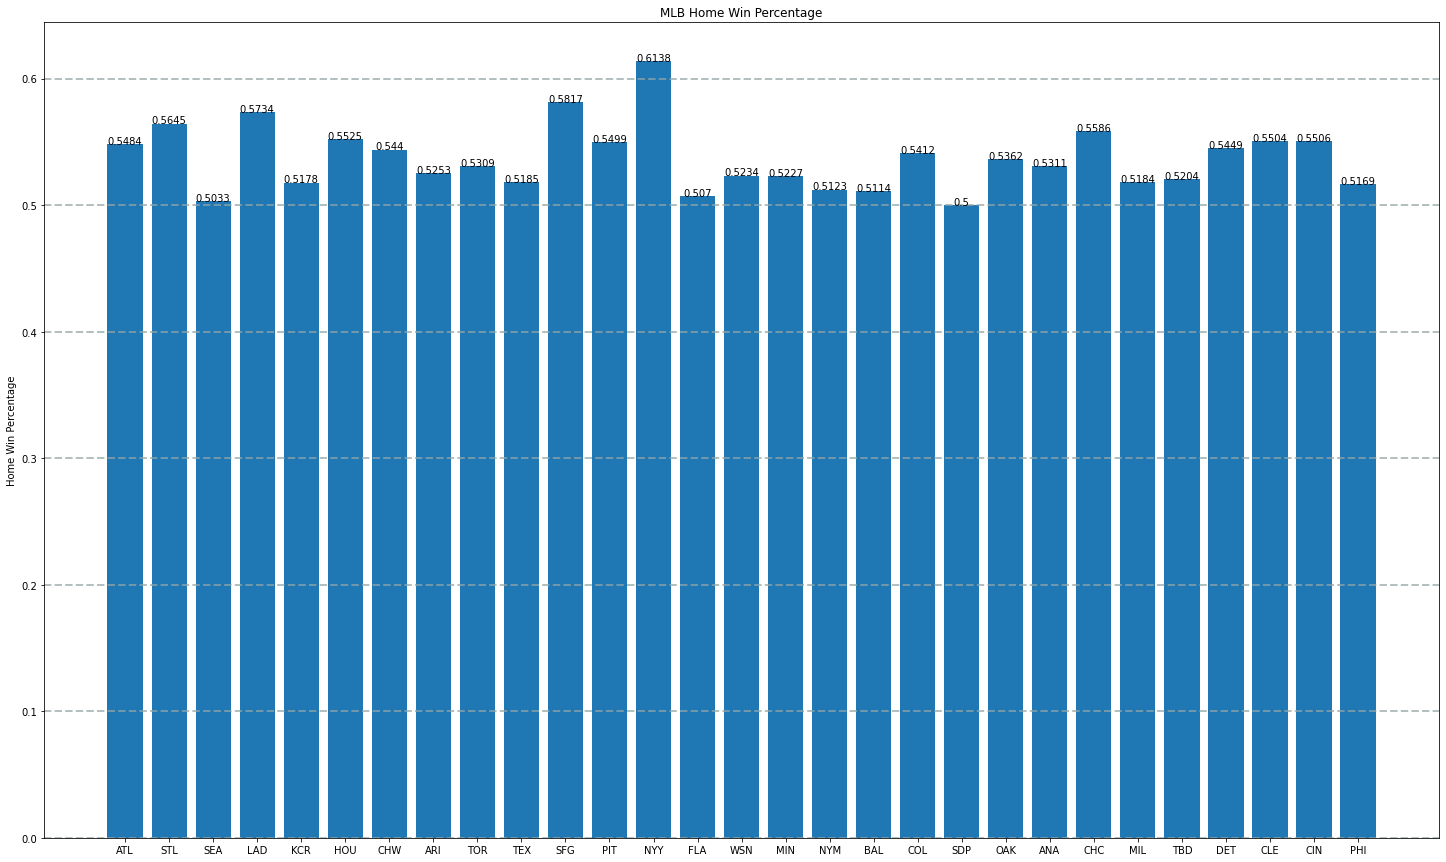
The Yankee’s take the cake with the highest win-to-loss ratio at home at 61.38%. The Padres Have an even 50/50 split at 50% with over 4000 games in the database, pretty wild. It’s looking like home field plays a large advantage in baseball, whether we like it or not.
With that being said, we know how all thirty teams perform at home, how do they look on the road? I calculated the exact ratio, but using the Away team instead to see how teams perform on the road. I took the win ratio, subtracted 50%, showing the likelyhood that a team is to win on the road. Negative values show that a team is more likely to lose, and positive showing that a team is more likely to win
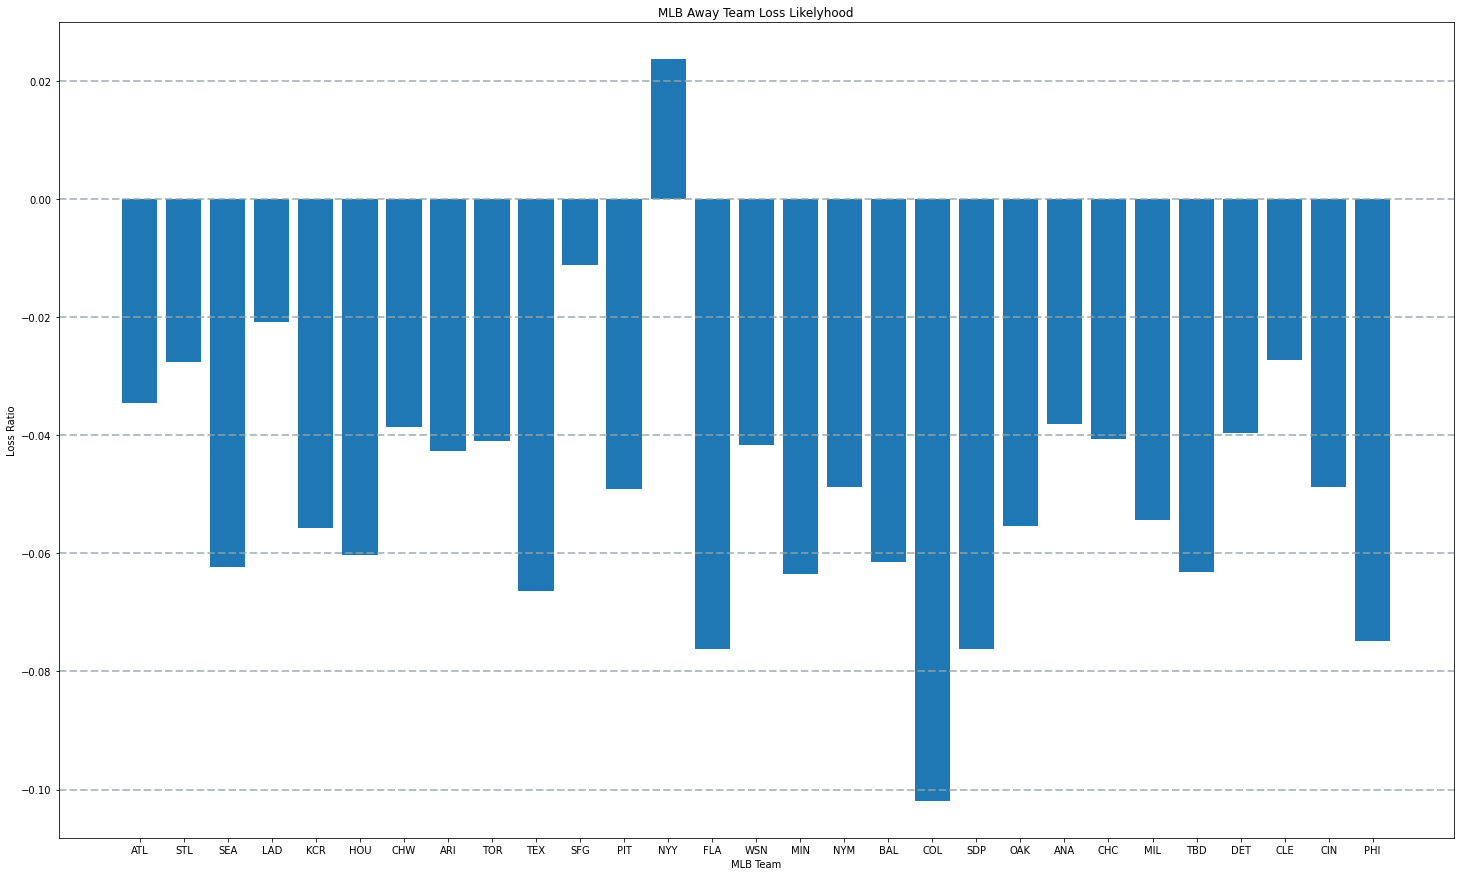
The data shows thay even on the road, the Yankees are 2.2% more likely to beat their opponent. The flipside of the coin is the Rockies that are 10% more likely to lose against their opponent if they are away.
So unless you’re the Yankees, you don’t have favorable odds of winning when you’re the away team. Really interesting data to see!
The Meaning
So what does all of this say? In baseball, the data shows that home field plays an advantage, up to as much as 11% in the case of the Yankees. Opposing teams are more likely to lose…unless you’re the Yankees. I’m curious on how this information looks strictly in the playoffs, as teams are playing for the big kahuna. This may be a future blog post. Comment below if you’re interested in seeing it
Please consider subscribing and commenting Below if you enjoyed!
As always, thank you for taking the time to read my artice!
-Jon
The Sources
The main source for this is the 538 Baseball Kaggle dataset, all code and graphs are developed by Jon Barker. If you are interested, send me an email and I will send my code.
If your’re interested in other really neat articles about baseball home field advantage, check out this really cool article done by the Society for American Baseball Research

Leave a comment